---
title: "2: Measuring Institutions with the Worldwide Governance Indicators"
date: '2025-11-07'
---
# 1. Introduction
How do we measure something as abstract as "institutions"? This fundamental challenge has puzzled economists and political scientists for decades. While we can observe the outcomes of institutional arrangements - economic growth, political stability, or corruption scandals - measuring the quality of institutions themselves is far more complex. Not only, but also because the definition of an institution differs across economic paradigms, as discussed in [this lecture](/content/material/s_05_Institutions1.qmd).
The Worldwide Governance Indicators (WGI), developed by the World Bank, represent one of the most influential attempts to quantify institutional quality. Since 1996, the WGI have provided standardized measures of governance across more than 200 countries, influencing everything from aid allocation to academic research on development.
## Why Measuring Institutions Matters
Institutional measurement isn't merely an academic exercise. The WGI and similar indicators shape real-world decisions:
- **Development aid** allocation increasingly depends on governance scores
- **Foreign investment** flows are influenced by institutional quality rankings
- **Policy reforms** are often designed to improve specific governance indicators
- **Academic research** on institutions and development relies heavily on these measures
Understanding both the power and limitations of institutional indicators is crucial for anyone studying development economics.
## What You'll Learn
This tutorial introduces you to the WGI framework while maintaining a critical perspective on institutional measurement. You'll learn how to access and analyze WGI data, understand what these indicators capture and miss, and connect them to broader debates in institutional economics.
Rather than treating the WGI as objective truth, we'll explore how these measures reflect particular theoretical assumptions about what constitutes "good governance" - assumptions that may not apply universally across different contexts and development models.
# 2. Understanding the WGI Framework
## 2.1 The Six Dimensions of Governance
The WGI measures institutional quality along six dimensions, each capturing different aspects of governance:
- **Voice and Accountability**: Political participation, freedom of expression, and media independence
- **Political Stability and Absence of Violence**: Likelihood of political instability and politically motivated violence
- **Government Effectiveness**: Quality of public services, bureaucracy, and policy implementation
- **Regulatory Quality**: Government's ability to formulate and implement sound private sector policies
- **Rule of Law**: Confidence in legal rules, property rights, police, and courts
- **Control of Corruption**: Extent to which public power is not exercised for private gain
The WGI are composite indicators built from hundreds of underlying data sources, including:
- **Expert surveys** from think tanks and NGOs
- **Business surveys** on regulatory environment and corruption
- **Citizen surveys** on government performance and services
- **Objective indicators** like press freedom indices
These diverse sources are aggregated using an "Unobserved Components Model" that assumes all sources measure the same underlying governance concept.
::: {.callout-note}
For detailed definitions and methodology, see the [official WGI documentation](https://www.worldbank.org/en/publication/worldwide-governance-indicators/documentation).
:::
::: {.callout-important}
## Key Methodological Issues
For detailed critiques and responses, see the [World Bank's external assessment](https://documents.worldbank.org/en/publication/documents-reports/documentdetail/099951310312414964) and [project updates](https://www.worldbank.org/en/publication/worldwide-governance-indicators/project-updates).
:::
## 2.2 Connecting WGI to Institutional Theory
The WGI framework reflects particular theoretical commitments about what constitutes good governance. Let's examine how these dimensions align with different schools of institutional economics:
::: {.callout-tip}
## Exercise: WGI and Institutional Theory
Fill in the table below by matching WGI dimensions to institutional economics paradigms. Consider which aspects of institutions are emphasized and which might be missing.
| WGI Dimension | NIE Focus (Property rights, contracts, transaction costs) | OIE Concerns (Power, social embeddedness, ceremonial institutions) | Missing Aspects |
|---------------|-----------------------------------------------------------|-------------------------------------------------------------------|-----------------|
| Rule of Law | | | |
| Regulatory Quality | | | |
| Government Effectiveness | | | |
| Control of Corruption | | | |
| Voice & Accountability | | | |
| Political Stability | | | |
:::
::: {.callout-note collapse="true"}
## Possible Solution
| WGI Dimension | NIE Focus | OIE Concerns | Missing Aspects |
|---------------|-----------|--------------|-----------------|
| Rule of Law | ✓ Strong focus on property rights protection and contract enforcement | Limited attention to whose interests laws serve, power relations in legal system | Labor rights, collective bargaining institutions |
| Regulatory Quality | ✓ Emphasis on private sector-friendly policies, reducing business costs | Ignores distributional effects, assumes market solutions optimal | Industrial policy, state capacity for structural transformation |
| Government Effectiveness | ✓ Efficient service delivery, bureaucratic quality | Little consideration of democratic input, social priorities | Welfare state institutions, public participation |
| Control of Corruption | ✓ Reducing transaction costs from rent-seeking | Narrow focus on individual behavior vs. systemic corruption | Regulatory capture by powerful interests |
| Voice & Accountability | Limited - mainly procedural democracy | ✓ Some attention to participation | Economic democracy, worker voice, inequality |
| Political Stability | ✓ Predictable environment for investment | Potential bias toward status quo, ignores legitimate grievances | Social movements, transformative change |
**Key Insight**: The WGI framework aligns closely with NIE concerns about transaction costs and property rights, but largely ignores OIE themes around power, social embeddedness, and institutional change. Important institutional dimensions like labor relations, welfare systems, and industrial policy are notably absent.
This critique mirrors the discussion of Acemoglu, Johnson & Robinson's work in the institutional economics lecture, where we saw how their focus on "Global Standard Institutions" reflects a narrow, Western-centric view of good governance that may not be universally applicable.
:::
## 2.3 Theory-Ladenness of Institutional Measurement
The previous exercise shows that the WGI framework is far from neutral but rather embeds particular assumptions about good governance:
- **Market-friendly bias**: Regulatory Quality heavily emphasizes policies that facilitate private business, potentially overlooking the value of regulations that protect workers, consumers, or the environment.
- **Liberal democratic model**: Voice & Accountability measures primarily capture Western-style democratic procedures, potentially missing other forms of legitimate political participation.
- **Stability bias**: Political Stability may inadvertently favor authoritarian regimes that maintain order at the expense of necessary social change.
- **Individual vs. systemic focus**: Control of Corruption emphasizes petty corruption while potentially missing "legal corruption" through campaign finance, lobbying, or regulatory capture.
Correspondingly, there are several important institutional dimensions that receive little attention in the WGI framework, such as:
- **Labor institutions**: Union rights, collective bargaining, worker protection
- **Welfare institutions**: Social insurance, redistribution mechanisms
- **Industrial policy institutions**: State capacity for economic transformation
- **Environmental governance**: Institutions for ecological sustainability
- **Gender institutions**: Formal and informal rules affecting women's participation
These omissions reflect the WGI's origins in the "good governance" agenda of the 1990s and the newer 'Global Standard Institutions', which prioritized market-friendly reforms over broader institutional development.
# 3. Accessing and Using WGI Data
## 3.1 Data Access
The WGI data can be accessed through multiple channels:
- **Interactive visualization**: [WGI Interactive Data Access](https://www.worldbank.org/en/publication/worldwide-governance-indicators/interactive-data-access)
- **Full dataset downloads**: Available in Excel and Stata formats from the same portal
- **World Bank API**: For programmatic access (though we'll use downloaded files here)
For systematic analysis, we recommend downloading the complete dataset in Stata format, which provides the most comprehensive data structure.
## 3.2 Reading WGI Data in R
```{r}
#| code-summary: "Packages used for WGI analysis"
library(haven)      # For reading Stata files
library(readr)
library(dplyr)
library(ggplot2)
library(ggpubr)
library(tidyr)
library(corrplot)   # For correlation matrices
library(countrycode)
library(kableExtra) # For table formatting
library(purrr)      # For map functions
library(tibble)     # For tibble functions
```
The basic WGI data looks like this:
```{r}
wgi_data <- read_dta("wgidataset.dta")
wgi_data %>%
  slice_head(n = 6) %>%
  kable(
    caption = "Raw WGI data structure (2020 data for selected countries)",
    # col.names = c("Country", "Year", "Voice & Accountability", "Political Stability",
    #               "Government Effectiveness", "Regulatory Quality", "Rule of Law",
    #               "Control of Corruption"),
    digits = 2
  ) %>%
  kable_styling(bootstrap_options = c("striped", "hover"))
```
So you have the following variables:
- `codeindyr`: An identifier for the particular observation that you are most like not use.
- `code` and `countryname`: The `iso3c` country code and its full name
- `year`: The year for the observation
- `indicator`: The name of the indicator in its abbreviated form; `cc`, for instance, stands for 'Control of Corruption'
- `nsource`: The number of data sources used to compute the indicator value
- `estimate`: The observation value in its original unit, i.e. the aggregation of the `nsource` sources
- `stddev`: The standard variation of the aggregation of the sources; this is a measure of the confidence you can have in the `estimate`: the smaller the value, the more the different sources agree
- `pctrank`: An alternative way to look at the indicators; instead of looking at the actual units as in `estimate`, here you look at the percentile ranks of the observation (i.e. in a relative fashion); thus, it goes from 0 to 100.
- `pctranklower` and `pctrankupper`: the lower and upper limit of of the 90% confidence interval associated with the `pctrank` (just as `stddev`, it is a measure of the uncertainty involved in the data aggregation)
In the following, we will take the most basic approach and only look at the estimates directly. For actual research, you should take into account the uncertainty measures as well:
```{r}
# Process the real WGI data

# Map indicator codes to full names for better labels
indicator_labels <- c(
  "va" = "Voice & Accountability",
  "pv" = "Political Stability",
  "ge" = "Government Effectiveness",
  "rq" = "Regulatory Quality",
  "rl" = "Rule of Law",
  "cc" = "Control of Corruption"
)

# Transform the long format data to wide format
wgi_sample <- wgi_data %>%
  # Select relevant columns and rename for consistency
  select(country = countryname, year, indicator, estimate) %>%
  # Rename 'pv' to 'ps' for consistency with previous naming
  mutate(indicator = ifelse(indicator == "pv", "ps", indicator)) %>%
  # Reshape to wide format
  pivot_wider(names_from = indicator, values_from = estimate) %>%
  # Remove rows with all missing values
  filter(!is.na(va) | !is.na(ps) | !is.na(ge) | !is.na(rq) | !is.na(rl) | !is.na(cc)) %>%
  rowwise() %>%
  dplyr::mutate(governance_avg = mean(c_across(cc:va), na.rm = TRUE)) %>%
  ungroup()

# Show sample of data structure
wgi_sample %>%
  filter(year == 2020) %>%
  select(country, year, va, ps, ge, rq, rl, cc, governance_avg) %>%
  slice_head(n = 6) %>%
  kable(
    caption = "Sample WGI data structure for the reduced version (2020 data for selected countries)",
    col.names = c("Country", "Year", "Voice & Accountability", "Political Stability",
                  "Government Effectiveness", "Regulatory Quality", "Rule of Law",
                  "Control of Corruption", "Average"),
    digits = 2
  ) %>%
  kable_styling(bootstrap_options = c("striped", "hover"))
```
```{r}
#| label: tbl-development-summary
#| tbl-cap: "Countries with highest and lowest governance scores (2018-2022 average)"
wgi_sample_avg <- wgi_sample %>%
  summarise(across(
    .cols = everything(),
    .fns = ~ mean(.x, na.rm=TRUE)),
    .by = "country") %>%
  select(-year)

# Show top and bottom countries by governance
top_countries <- wgi_sample_avg %>%
  arrange(desc(governance_avg)) %>%
  slice_head(n = 5) %>%
  mutate(governance_avg = round(governance_avg, 2))

bottom_countries <- wgi_sample_avg %>%
  arrange(governance_avg) %>%
  slice_head(n = 5) %>%
  mutate(governance_avg = round(governance_avg, 2))

bind_rows(
  top_countries %>% mutate(Category = "Highest Governance"),
  bottom_countries %>% mutate(Category = "Lowest Governance")
) %>%
  select(Category, country, governance_avg) %>%
  kable(
    col.names = c("Category", "Country", "Average WGI Score"),
    caption = "Countries with highest and lowest governance scores"
  ) %>%
  kable_styling(bootstrap_options = c("striped", "hover")) %>%
  pack_rows("Highest Governance Scores", 1, 5) %>%
  pack_rows("Lowest Governance Scores", 6, 10)
```
## 3.3 Visualizing WGI Trends
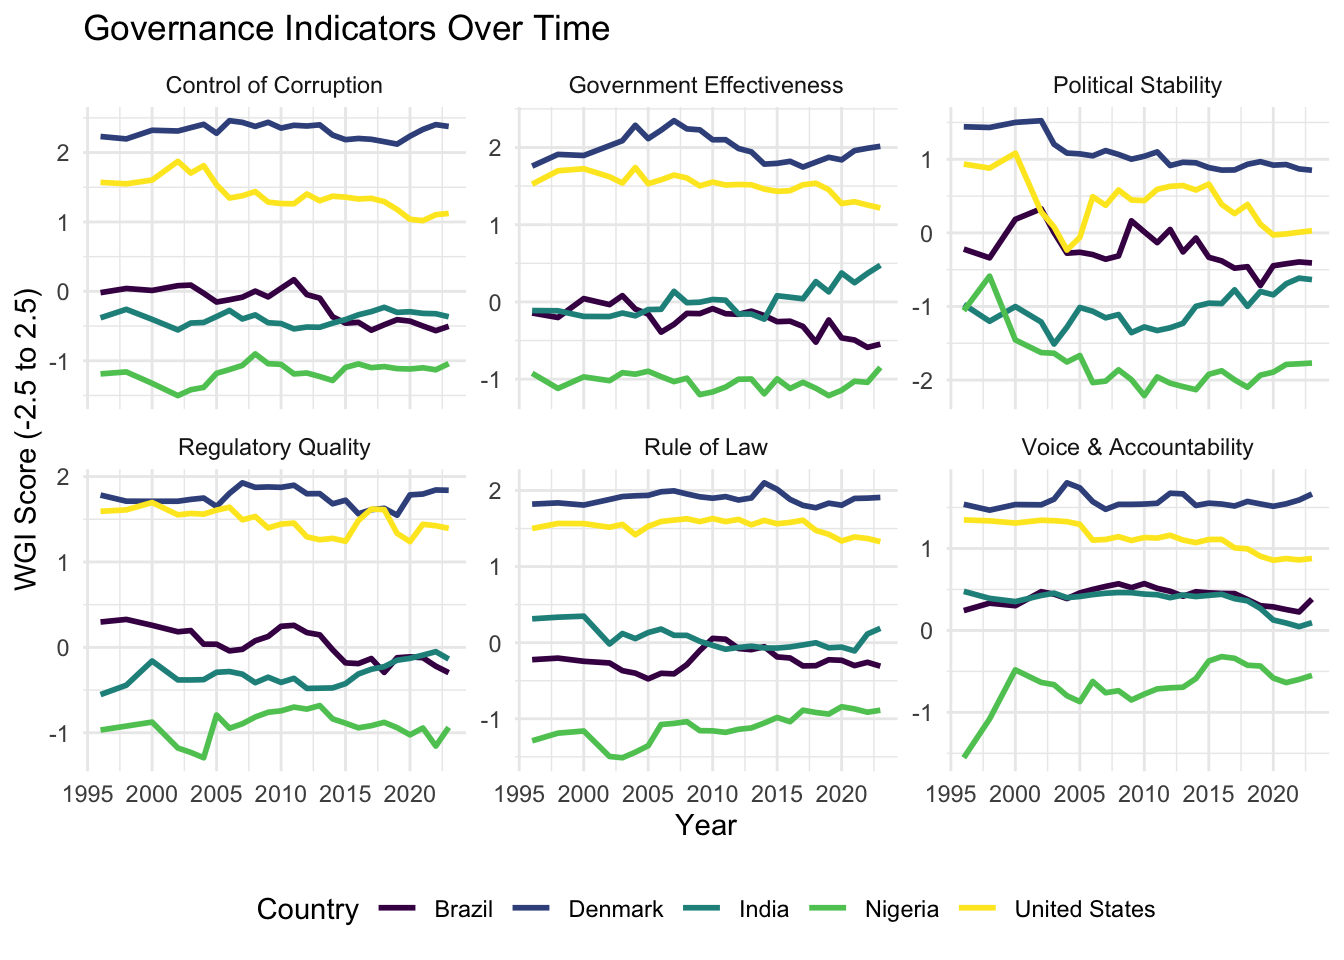
@fig-wgi-trends shows how the governance indicators have evolved over time for some selected countries.
```{r}
#| label: fig-wgi-trends
#| fig-cap: "WGI trends for selected countries (2000-2022). Note the different trajectories across countries and dimensions."
#| cap-location: top
# Reshape data for plotting
wgi_long <- wgi_sample %>%
  pivot_longer(cols = va:cc, names_to = "indicator", values_to = "score") %>%
  mutate(
    indicator = case_when(
      indicator == "va" ~ "Voice & Accountability",
      indicator == "ps" ~ "Political Stability",
      indicator == "ge" ~ "Government Effectiveness",
      indicator == "rq" ~ "Regulatory Quality",
      indicator == "rl" ~ "Rule of Law",
      indicator == "cc" ~ "Control of Corruption"
    )
  )

# Plot trends for a subset of countries
selected_countries <- c("Denmark", "United States", "Brazil", "India", "Nigeria")

wgi_long %>%
  filter(country %in% selected_countries) %>%
  ggplot(aes(x = year, y = score, color = country)) +
  geom_line(linewidth = 1) +
  facet_wrap(~indicator, scales = "free_y") +
  scale_color_viridis_d() +
  labs(
    title = "Governance Indicators Over Time",
    x = "Year",
    y = "WGI Score (-2.5 to 2.5)",
    color = "Country"
  ) +
  theme_minimal() +
  theme(legend.position = "bottom")
```
## 3.4 Correlation Among WGI Dimensions
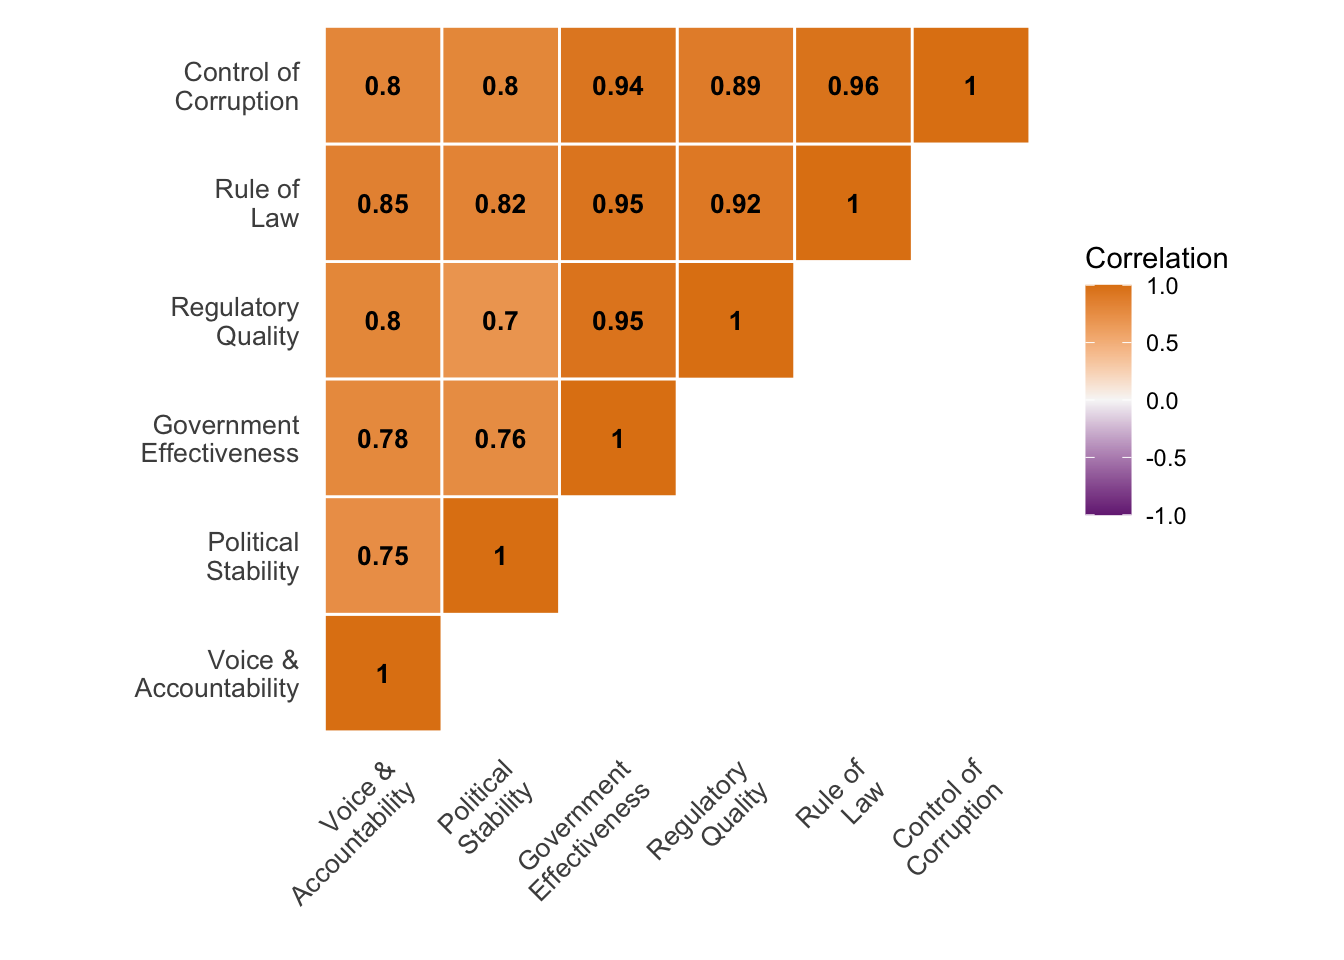
But how do the different governance dimensions relate to each other? We'll first look at correlations across the entire sample, then examine whether these relationships differ across specific countries.
```{r}
#| label: tbl-wgi-correlation-overall
#| tbl-cap: "Correlation matrix among WGI dimensions (overall sample, 2000-2022 averages)"
# Calculate correlations for the overall sample using country averages
wgi_avg <- wgi_sample %>%
  group_by(country) %>%
  summarise(across(va:cc, mean, na.rm = TRUE), .groups = "drop") %>%
  # Remove countries with all missing values
  filter(if_any(va:cc, ~!is.na(.)))

# Calculate correlation matrix
cor_matrix_overall <- cor(wgi_avg %>% select(va:cc), use = "complete.obs")

# Format correlation matrix for display
cor_matrix_overall %>%
  as.data.frame() %>%
  rownames_to_column("Indicator") %>%
  mutate(
    Indicator = case_when(
      Indicator == "va" ~ "Voice & Accountability",
      Indicator == "ps" ~ "Political Stability",
      Indicator == "ge" ~ "Government Effectiveness",
      Indicator == "rq" ~ "Regulatory Quality",
      Indicator == "rl" ~ "Rule of Law",
      Indicator == "cc" ~ "Control of Corruption"
    )
  ) %>%
  kable(digits = 3,
        col.names = c("Indicator", "VA", "PS", "GE", "RQ", "RL", "CC")) %>%
  kable_styling(bootstrap_options = c("striped", "hover"))
```
The correlation matrix in @tbl-wgi-correlation-overall shows high correlations among most WGI dimensions, suggesting they may not capture truly independent aspects of governance.
```{r}
#| label: fig-wgi-correlation-ggplot
#| fig-cap: "Visual correlation matrix among WGI dimensions (overall sample). High correlations suggest dimensions may not be truly independent."
library(ggplot2)

# Create full indicator names with line breaks
indicator_names <- c(
  "va" = "Voice &\nAccountability",
  "ps" = "Political\nStability",
  "ge" = "Government\nEffectiveness",
  "rq" = "Regulatory\nQuality",
  "rl" = "Rule of\nLaw",
  "cc" = "Control of\nCorruption"
)

# Convert correlation matrix to long format first
cor_df <- cor_matrix_overall %>%
  as.data.frame() %>%
  rownames_to_column("var1") %>%
  pivot_longer(-var1, names_to = "var2", values_to = "correlation") %>%
  mutate(
    var1_num = as.numeric(factor(var1, levels = names(indicator_names))),
    var2_num = as.numeric(factor(var2, levels = names(indicator_names)))
  ) %>%
  # Keep only upper triangle (including diagonal)
  filter(var1_num <= var2_num) %>%
  mutate(
    var1_label = indicator_names[var1],
    var2_label = indicator_names[var2],
    var1 = factor(var1, levels = names(indicator_names)),
    var2 = factor(var2, levels = names(indicator_names)),
    var1_label = factor(var1_label, levels = indicator_names),
    var2_label = factor(var2_label, levels = indicator_names)
  )

ggplot(cor_df, aes(x = var1_label, y = var2_label, fill = correlation)) +
  geom_tile(color = "white", linewidth = 0.5) +
  geom_text(aes(label = round(correlation, 2)), size = 3.5, fontface = "bold") +
    scale_fill_gradient2(low = "#762a83", mid = "#f7f7f7", high = "#e08214",
                       midpoint = 0, limit = c(-1, 1)) +
  labs(x = "", y = "", fill = "Correlation") +
  theme_minimal() +
  theme(
    axis.text.x = element_text(angle = 45, hjust = 1, vjust = 1, size = 10),
    axis.text.y = element_text(size = 10),
    legend.position = "right",
    panel.grid = element_blank(),
    axis.ticks = element_blank()
  ) +
  coord_fixed()
```
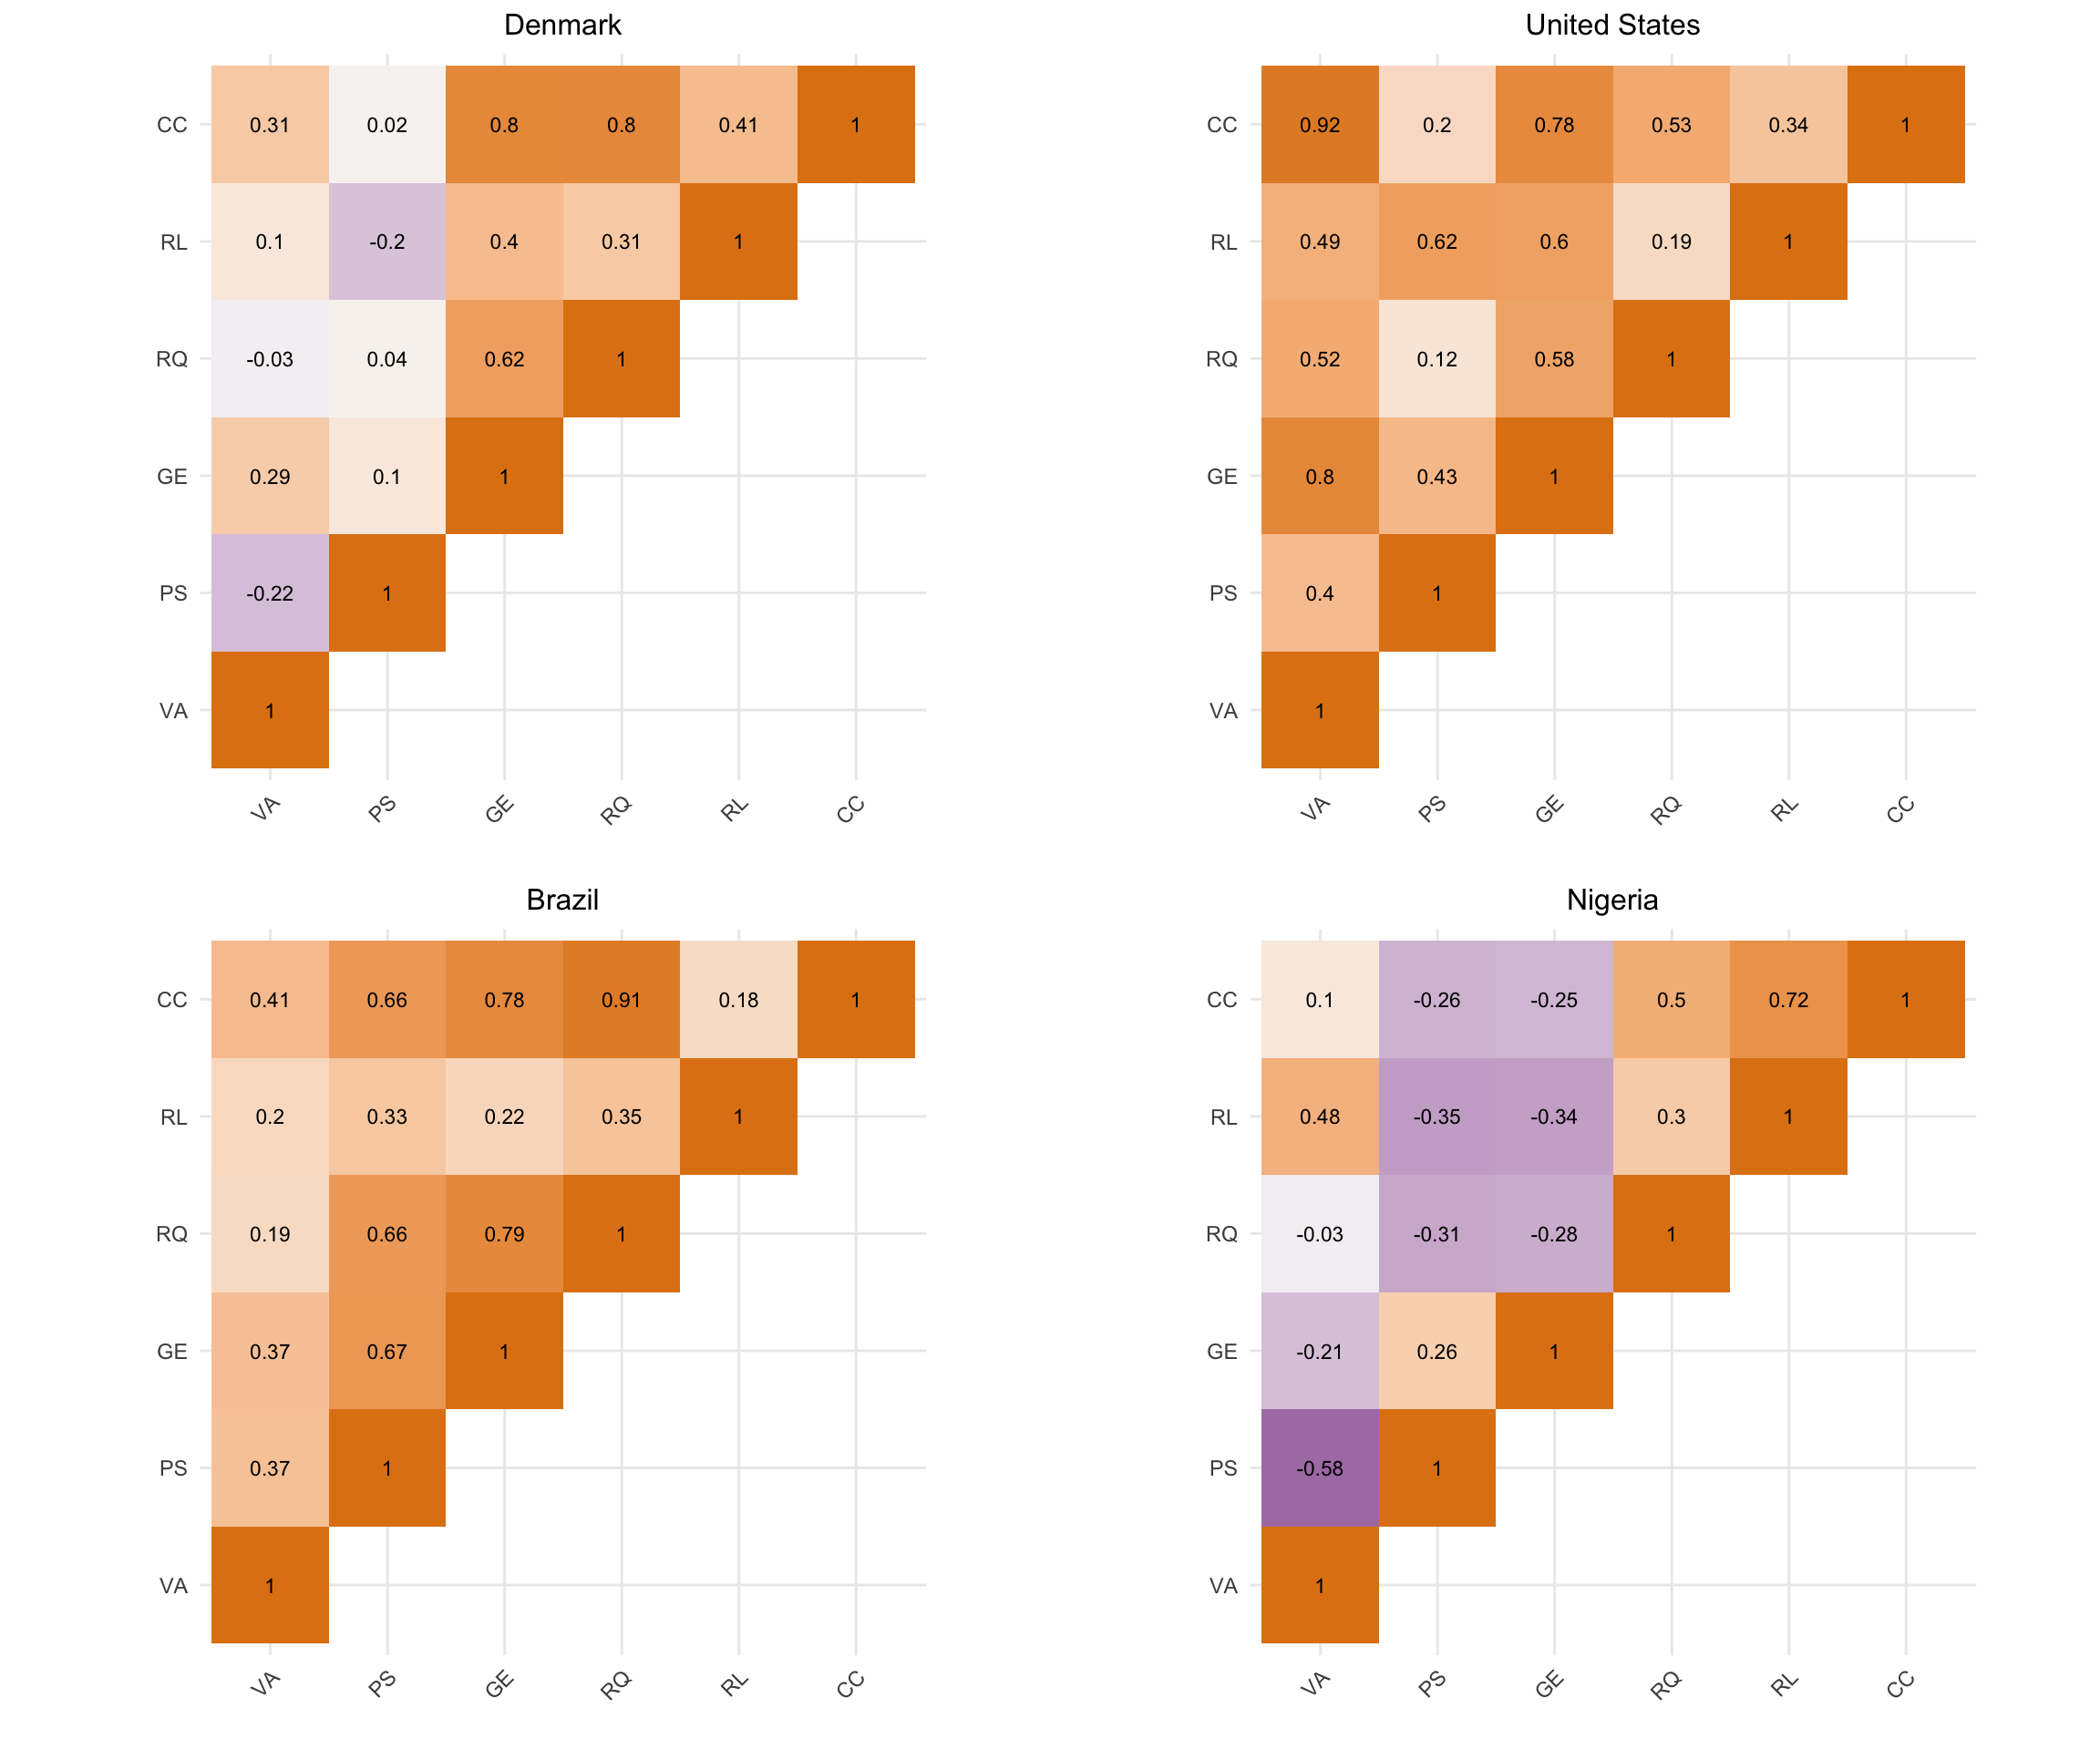
Now let's examine whether these correlation patterns differ across countries with different development levels and institutional characteristics. Here, @tbl-wgi-correlation-countries reveals interesting patterns: correlations among governance dimensions may vary significantly across countries, suggesting that the relationship between different aspects of governance is context-dependent.
```{r}
#| label: tbl-wgi-correlation-countries
#| tbl-cap: "Correlation patterns across selected countries (2000-2022 averages)"
# Calculate correlations for specific countries
selected_countries <- c("Denmark", "United States", "Brazil", "Nigeria")

country_correlations <- map_dfr(selected_countries, function(country_name) {
  country_data <- wgi_sample %>%
    filter(country == country_name) %>%
    select(va:cc)

  if(nrow(country_data) > 5) {  # Ensure enough observations
    cor_matrix <- cor(country_data, use = "complete.obs")
    # Extract upper triangle correlations
    upper_tri_values <- cor_matrix[upper.tri(cor_matrix)]

    tibble(
      Country = country_name,
      `Mean Correlation` = round(mean(upper_tri_values, na.rm = TRUE), 3),
      `Min Correlation` = round(min(upper_tri_values, na.rm = TRUE), 3),
      `Max Correlation` = round(max(upper_tri_values, na.rm = TRUE), 3),
      `Std Dev` = round(sd(upper_tri_values, na.rm = TRUE), 3)
    )
  } else {
    tibble(Country = country_name, `Mean Correlation` = NA,
           `Min Correlation` = NA, `Max Correlation` = NA, `Std Dev` = NA)
  }
})

country_correlations %>%
  kable(caption = "Summary of WGI correlations by country") %>%
  kable_styling(bootstrap_options = c("striped", "hover"))
```
```{r}
#| label: fig-wgi-correlation-countries-ggplot
#| fig-cap: "Correlation matrices for selected countries. Different patterns suggest governance dimensions relate differently across institutional contexts."
#| fig-width: 12
#| fig-height: 10
# Select four countries with different development levels
selected_countries <- c("Denmark", "United States", "Brazil", "Nigeria")

# Function to create correlation plot for a single country using ggplot2
create_country_corrplot_ggplot <- function(country_name) {
  country_data <- wgi_sample %>%
    filter(country == country_name) %>%
    select(va, ps, ge, rq, rl, cc) %>%
    filter(complete.cases(.))

  if(nrow(country_data) > 5) {
    cor_matrix <- cor(country_data, use = "complete.obs")

    # Set lower triangle to NA to show only upper triangle
    cor_matrix[lower.tri(cor_matrix)] <- NA

    # Convert correlation matrix to long format for ggplot
    cor_df <- cor_matrix %>%
      as.data.frame() %>%
      rownames_to_column("var1") %>%
      pivot_longer(-var1, names_to = "var2", values_to = "correlation") %>%
      filter(!is.na(correlation)) %>%  # Remove NA values (lower triangle)
      mutate(
        var1 = factor(var1, levels = c("va", "ps", "ge", "rq", "rl", "cc")),
        var2 = factor(var2, levels = c("va", "ps", "ge", "rq", "rl", "cc"))
      )

    ggplot(cor_df, aes(x = var1, y = var2, fill = correlation)) +
      geom_tile() +
      geom_text(aes(label = round(correlation, 2)), size = 3) +
      scale_fill_gradient2(
        low = "#762a83", mid = "#f7f7f7", high = "#e08214",
        midpoint = 0, limit = c(-1, 1)) +
      scale_x_discrete(labels = c("VA", "PS", "GE", "RQ", "RL", "CC")) +
      scale_y_discrete(labels = c("VA", "PS", "GE", "RQ", "RL", "CC")) +
      labs(title = country_name, x = "", y = "", fill = "Correlation") +
      theme_minimal() +
      theme(
        axis.text.x = element_text(angle = 45, hjust = 1),
        plot.title = element_text(hjust = 0.5, size = 12),
        legend.position = "none"
      ) +
      coord_fixed()
  } else {
    # Return empty plot if insufficient data
    ggplot() +
      labs(title = paste(country_name, "(Insufficient data)")) +
      theme_void()
  }
}

# Create plots for each country
plots <- map(selected_countries, create_country_corrplot_ggplot)

# Arrange plots in 2x2 grid
ggarrange(plotlist = plots, ncol = 2, nrow = 2)
```
# 5. Governance and Development Outcomes
## 5.1 WGI and Economic Development
Let's examine how governance indicators correlate with development outcomes.
We'll use World Bank data to look at the relationship between governance quality and key development indicators.
For the sake of simplicity we look at the averages of the indicators for the years 2018 to 2022 (see @tbl-wdi-data).
```{r}
#| code-summary: "How to download data from the World Bank API"
#| eval: false
library(WDI)

# Define the indicators to download
development_indicators <- c(
  "gdp_pc_ppp" = "NY.GDP.PCAP.PP.CD",      # GDP per capita (PPP, current international $)
  "gini" = "SI.POV.GINI",                  # Gini coefficient
  "life_exp" = "SP.DYN.LE00.IN"            # Life expectancy at birth (years)
)

# Download the data for all countries, recent years
development_data_raw <- WDI(
  indicator = development_indicators,
  start = 2018,     # Start from 2015 to get recent data
  end = 2022,       # End at 2022 (latest available)
  extra = TRUE      # Include region and income level info
) %>%
  # Remove aggregates (regions, income groups, etc.)
  filter(region != "Aggregates", !is.na(region))

# Calculate averages for recent years to match with governance data
development_data_clean <- development_data_raw %>%
  group_by(country) %>%
  summarise(
    gdp_pc_ppp = mean(gdp_pc_ppp, na.rm = TRUE),
    gini = mean(gini, na.rm = TRUE),
    life_exp = mean(life_exp, na.rm = TRUE),
    .groups = "drop"
  ) %>%
  # Remove countries with all missing data
  filter(!is.na(gdp_pc_ppp) | !is.na(gini) | !is.na(life_exp))

write_csv(x = development_data_clean, file = "wdi_indicators.csv")
```
```{r}
#| label: tbl-wdi-data
#| tbl-cap: "WDI data used (2018-2022 average)"
development_data_clean <- read_csv("wdi_indicators.csv")

# Show sample of the data
development_data_clean %>%
  slice_head(n = 10) %>%
  mutate(across(where(is.numeric), ~round(.x, 2))) %>%
  kable(
    caption = "Sample of World Bank development indicators (2018-2022 averages)",
    col.names = c("Country", "GDP per capita (PPP)", "Gini coefficient", "Life expectancy")
  ) %>%
  kable_styling(bootstrap_options = c("striped", "hover"))
```
## 5.2 Governance Dimensions Analysis
Let's examine which governance dimensions tend to cluster together:
```{r}
#| label: fig-governance-dimensions
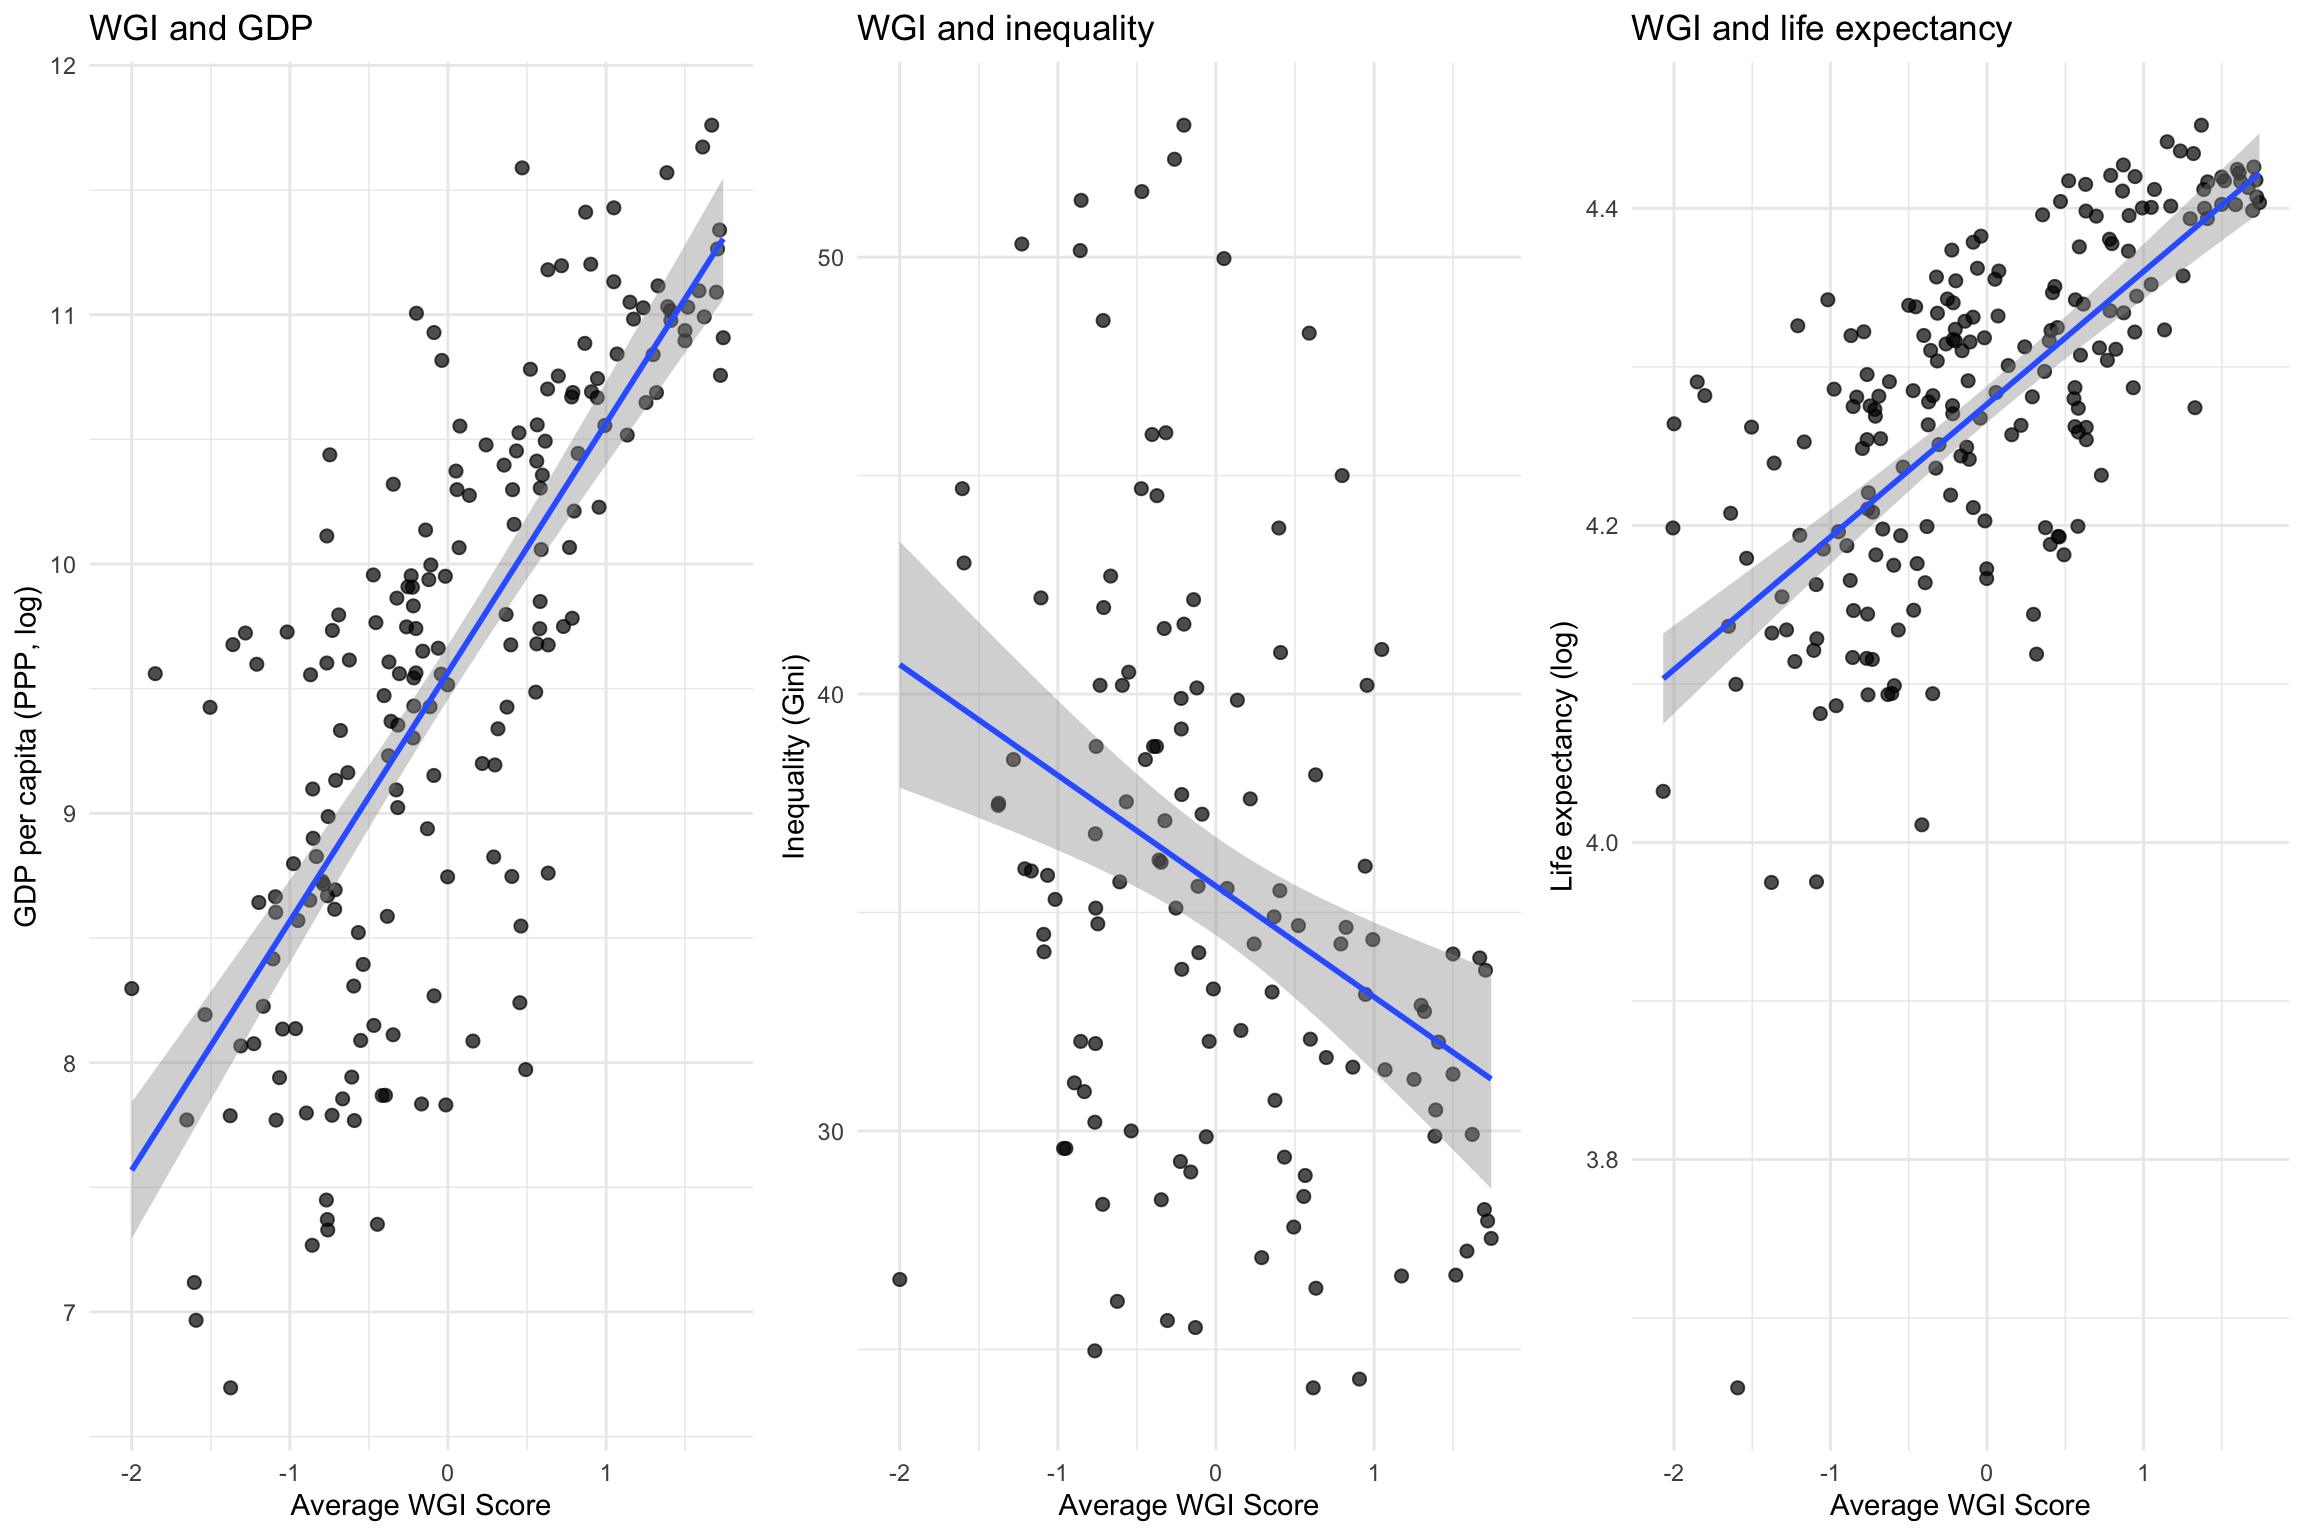
#| fig-cap: "Relationship between different governance dimensions. High correlations suggest these may measure similar underlying concepts."
#| fig-width: 12
#| fig-height: 8
library(ggpubr)

wgi_data_clean <- wgi_sample %>%
  filter(year >= 2018, year <= 2022) %>%
  summarise(across(.cols = everything(), .fns = ~ mean(.x, na.rm=TRUE)), .by = "country") %>%
  select(-year)

full_dev_data <- full_join(
  x = wgi_data_clean,
  y = development_data_clean,
  by = "country")

# Create scatter plots for key governance dimension pairs
p1 <- ggplot(full_dev_data, aes(x = governance_avg, y = log(gdp_pc_ppp))) +
  geom_point(alpha = 0.7, size = 2) +
  geom_smooth(method = "lm", se = TRUE) +
  labs(
    title = "WGI and GDP",
    x = "Average WGI Score",
    y = "GDP per capita (PPP, log)"
  ) +
  theme_minimal()

p2 <- ggplot(full_dev_data, aes(x = governance_avg, y = gini)) +
  geom_point(alpha = 0.7, size = 2) +
  geom_smooth(method = "lm", se = TRUE) +
  labs(
    title = "WGI and inequality",
    x = "Average WGI Score",
    y = "Inequality (Gini)"
  ) +
  theme_minimal()

p3 <- ggplot(full_dev_data, aes(x = governance_avg, y = log(life_exp))) +
  geom_point(alpha = 0.7, size = 2) +
  geom_smooth(method = "lm", se = TRUE) +
  labs(
    title = "WGI and life expectancy",
    x = "Average WGI Score",
    y = "Life expectancy (log)"
  ) +
  theme_minimal()


ggarrange(p1, p2, p3, ncol = 3, nrow = 1)
```
On average, there appears to be a clear relationship between the governance performance and GDP as well as life expectancy.
The relationship with inequality is, surprisingly, much less clear and tends to be even negative.
But even the positive correlation with GDP does not answer the corresponding questions:
- **Do good institutions cause development?** This is the core claim of New Institutional Economics, supported by studies like Acemoglu, Johnson, and Robinson's colonial origins work.
- **Does development enable better institutions?** Alternative explanations suggest that economic growth provides resources for institutional improvements.
- **Do both reflect common factors?** Historical, cultural, or geographic factors might simultaneously influence both institutional quality and development outcomes.
- **Reverse causation concerns**: Successful development may make countries appear to have better governance simply because they can afford better public services and less corruption.
All these intricacies make institutional analysis a very challenging but also very exciting subject.
# 6. Applications and Scholarly Uses
The WGI have been used extensively in academic research and policy analysis. Here are some key applications:
- TBA
# 7. Summary and Critical Reflections
## Key Takeaways
**Institutions clearly matter for development**, but measuring them objectively is extraordinarily difficult. The WGI represent an ambitious attempt to quantify governance quality, but they embed particular theoretical assumptions about what constitutes good institutions.
**The WGI framework aligns closely with New Institutional Economics** concerns about property rights, transaction costs, and market-friendly policies. However, it largely overlooks Original Institutional Economics themes around power relations, social embeddedness, and institutional change.
**High correlations among WGI dimensions on the aggregate** suggest they may measure a single underlying "governance quality" factor rather than truly distinct institutional aspects.
**Heterogeneous correlations on the country level**, on the other hand, suggest that it is very important to look at single countries more closely to understand the specific relationship between the measured dimensions.
**Strong correlations between governance and development** don't establish causal relationships. The direction of causation remains hotly debated in the literature.
## Critical Questions that follow
1. **Whose definition of good governance?** The WGI framework reflects particular (Western, liberal) views about optimal institutions. Are these universally applicable?
2. **What's missing?** Important institutional dimensions like labor relations, welfare systems, and industrial policy receive little attention in governance indicators.
3. **Static vs. dynamic institutions**: The WGI provide snapshots of institutional quality but tell us little about processes of institutional change and development.
4. **Context specificity**: Do the same institutional arrangements work equally well across different development stages, cultural contexts, and economic structures?
## Moving Forward
As you encounter governance indicators in academic research and policy discussions, remember that these measures are tools with particular purposes and limitations. They can provide useful information about certain aspects of institutional quality, but they should not be treated as comprehensive or objective measures of institutional development.
The goal is to use these indicators critically and thoughtfully, understanding both what they reveal and what they obscure about the complex relationship between institutions and development.
## References for Further Reading
- TBA
---
- [Back to the tutorials overview](../../tutorials.qmd)